Best Web Performance tools

If something works on my system, it doesn't mean it's good for all. So, to know whether it's good or not up to the mark for everyone, we need some tools to test our website. So, let's talk about those.
There are three personas while discussing web pages and their construction:
- Developer mode
- Simulated Environment
- Real user data
For Real-Time Users
For real user data, we can use CRUX of Chrome. Read here: Overview of CrUX. It's basically Chrome’s user experience report, showing how real Chrome users experience a website. PageSpeed.web also comes under that, which can be used to analyze all web vitals for a web page: https://pagespeed.web.dev/.
Other tools:
- Request Metrics – You can use Request Metrics by injecting the script provided by them into your system to check performance.
- Microsoft Clarity – Another tool that can be used to check page-wise core vitals, error tracking, and much more.
- New Relic
- Sentry
- Google Analytics
For Simulated Data
To test simulated data, there are many tools available to analyze your website:
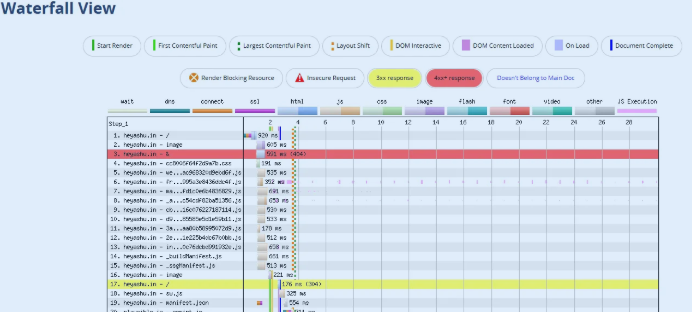
- WebPageTest – A great tool to get detailed data from different locations far from you.
For Developer mode
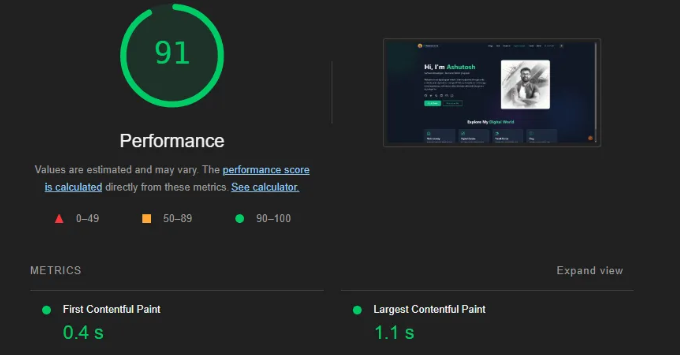
-Lighthouse
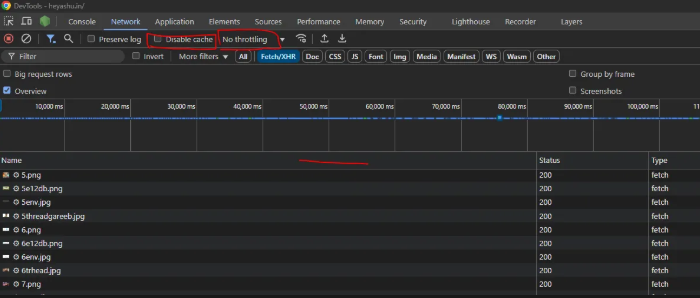
-Netwrok tab In Dev Tools, under the Network tab, you can see what is loading and when.
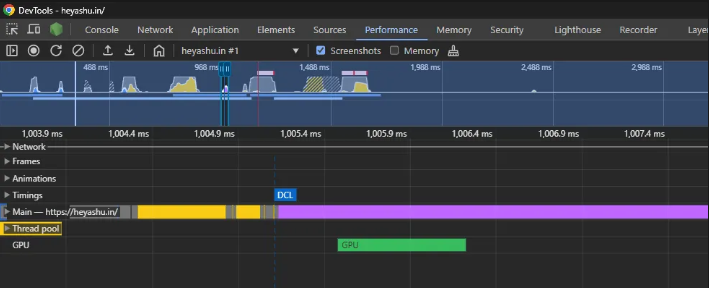
-Performance tab We can also tweak the Performance tab to check things in detail.
Note: Please test your web apps in incognito mode.
Always dock out your dev tools to test in full viewport.